|
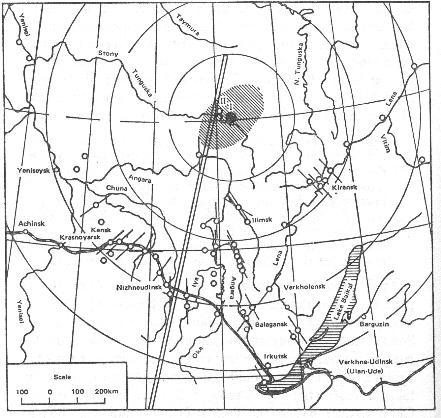
The first trajectory map created from eyewitness
accounts. It
was put
together by A.V. Voznesensky, former head of the Irkutsk Observatory,
in the mid 1920s and used by Kulik in his search for the epicenter. It
came within 44 miles of the epicenter. A higher resolution version - Voznesensky_mapHR.jpg Note: I believe the above map was originally published
in
Evgeny
Krinov's book "Giant Meteorite" 1966 Pergamon Press and might be a
version of Voznesensky's map
created specifically for the book rather than a
facimile copy. Copyright status unknown.
A micro-barograph recording (barogram) of the Tunguska explosion. A barograph is an instrument that records changes in air pressure, not to be confused with a seismograph, which, of course, measures earthquake magnitude. It was recorded the morning of June 30th, 1908 at South Kensington, London, England. As you can see, the Tunguska explosion appears to be separated by two distinct events. A low frequency event followed by a high frequency event. The high frequency event would be more characteristic of a nuclear explosion. 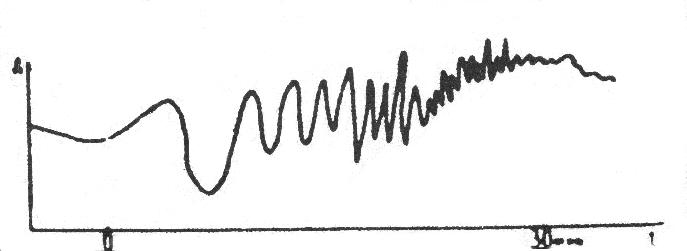 |
BACK TO MAIN PAGE
HOME
mysteries, commentary, sci-fi